Authors: Kaviarasan, K1. and D.R. Singh2, Prawin Arya3
1 Assistant Director, Department of Consumer Affairs, GOI, Krishi Bhawan, New Delhi,
2 Senior Scientist, Division of Agricultural Economics, IARI, New Delhi and
3 Senior Scientist, Div. of Forecasting and Agricultural Systems Modelling,
IASRI, New Delhi.
Introduction
Although, the flower cultivation has been practised in india since times immemorial, the floriculture has blossomed into a commercial venture only in recent years. Domestic consumption both for cut flowers as well as loose fowers have increased significantly owing rapid urbanisation, changes in social attitude and the increasing habit of ‘Saying it with flowers’. There has been increasingly demand for cut flowers like roses, gladiolus, carnation, orchid, lilium and gerbera. With increasing the consumption, production has been increased and non-traditional areas have emerged as important players in floriculture production. This has led to the transformation of floriculture sector from household activity to a commercial venture (Sivaramane et al., 2008 and Sudha, 2001). It is one of the fastest growing segments of horticulture, having potential for providing enhanced returns to farmers besides providing employment opportunities especially to women (Singh, 2009). Therefore, the government of India has identified floriculture as a focus area for development. Presently, India is the second largest producer of flowers after china. Tamil Nadu stands first in India in the area under flower cultivation (0.25 lakh ha) as well as production of loose flowers (2.02 lakh tonnes) in the year 2005-06. The production of flowers under diverse agro-climatic and socio-economic conditions has given rise to many issues related to growth and instability, productivity differences, costs and returns, efficiency, equity and employment in flower production. Although some of the issues were studied (Seethe, et al. 1985; Guledagudda, 1996; Goyal, 1999; Pushpalatha, et al., 1997; Sarkar & Rahim, 1997 and Jyothi et al., 2003), the efficiency, equity and linkages issues in the flower production need urgent attention. Keeping in mind the increasing importance of flowers crops in agricultural economy of Tamil Nadu, the study was undertaken to examine the economics and backward and forward linkages in rose production and identify the constraints to rose production and marketing. Suitable policy measures are suggested for efficient and effective value chain for enhancing the profitability of rose production system in a sustainable manner.
Data and methodology
The primary data on socio-economic aspects along with different input costs, yields, returns and employment in flower cultivation was collected through personal interview of the respondents with the help of specially structured and pre-tested schedule. For primary data collection, a cluster of two villages were selected randomly from each three randomly selected blocks from Krishnagiri District of North-Western Zone of Tamil Nadu. The lists of flower growers were prepared from each sample village and 150 farm households were selected randomly from selected blocks of the district. The data was pertaining to the agricultural year 2008-09. For the analysis, the selected farmers were categorized into three groups according to their size of land holdings as marginal (less than 1 hectare (ha)), small (1 to 2 ha) and others (greater than 2 ha). Tabular analysis was employed to study the establishment costs on rose garden, costs and returns, marketing cost and employment potential in rose production.
Growth analysis of area under rose crop was carried out by computing the compound growth rate (CGR) by fitting the exponential function. To measure the instability in rose area, Cuddy-Della Valle index (corrected coefficient of variation) was used which takes into consideration the long term trend. Establishment cost refers to pre-bearing costs incurred in the establishment and maintenance of rose garden up to economic harvesting stage (first harvest of flowers). This included land rent and costs incurred in the establishment of garden such as the cost of land preparation, digging pits or trenching, planting material, manures and fertilizers, cost of plant protection chemicals, cost of labour, etc . In order to assess the profitability and economic viability in flower cultivation, various cost and return concepts were used. Value of hired labour, cost of inputs such as seed, manures, fertilizers, insecticides and pesticides, hired machinery charges, imputed value of owned machine power, depreciation on implements and farm buildings, irrigation charges, land revenue, interest on working capital , establishment cost in rose flower and marketing cost paid by farmers were included in Cost A1. The marketing costs were also included as these costs had the major share in total costs incurred by the rose cultivators. The cost of production per unit of output was also calculated for jasmine, rose and chrysanthemum flowers. The returns over different costs were calculated for rose cultivation and the net return per unit of output was also calculated. Gini coefficient was calculated to measure inequality in returns realized from rose cultivation among different farm classes of farmers. Data envelopment analysis (DEA) is a multi-factor productivity analysis model for measuring the relative efficiencies of a homogenous set of decision making units. It is the non- parametric mathematical programming approach to frontier estimation. The DEA program version 2.1 has been used for the analysis. Garrett’s Ranking Technique was used to organize farmers’ responses on constraints to flower cultivation.
Results and discussion
Growth and instability in rose area
Rose flower had 7.4 per cent of the total area under flower cultivation in the state in TE 2006-07. District wise analysis of rose area showed that Dharmapuri district had the highest area of 465 ha during TE 2006-07 followed by 240 ha in Dindigal, 240 ha in Vellore and 235 ha in Thiruvallur districts (Table 1). The district-wise growth analysis for the year 1999-2000 to 2006-07 showed that the growth in the area under rose cultivation was impressive in Dharmapuri district followed by Madurai, Dindigal, Thirunelveli and Thiruvallur districts. On the other hand, Salem and Thiruvannamalai districts had negative annual growth of 12 and 9 per cent in the area under rose cultivation, respectively.
Table 1: Growth and instability in area under rose in major flower growing districts
| Districts | Area (ha.) | CGR (%) | Adjusted CV (%) | ||
| TE 2001-02 | TE 2006-07 | Change (%) | |||
| Dharmapuri | 254 | 465 | 83.31 | 11.7 | 25.1 |
| Dindigal | 184 | 240 | 30.43 | 6.5 | 24.7 |
| Vellore | 102 | 174 | 71.15 | 2.4 | 78.0 |
| Thiruvannamalai | 146 | 39 | -73.00 | -8.9 | 129.6 |
| Thirunelveli | 50 | 69 | 37.09 | 5.1 | 32.0 |
| Salem | 113 | 54 | -52.51 | -12.1 | 45.2 |
| Madurai | 72 | 80 | 11.11 | 10.2 | 68.0 |
| Thiruvallur | 167 | 235 | 40.52 | 4.8 | 26.6 |
| State | 1548 | 1795 | 15.98 | 3.2 | 11.2 |
In case of instability in the area under rose, it was high in all the major flower growing districts.
It may be concluded from the aforesaid discussion that although, there was an impressive growth in rose flower cultivation in most of the major flower growing districts of the state during the study period, the instability was also very high inmost of the districts.
Farm size and cropping pattern
The marginal farmers were comprised of 41 per cent of the total farmers having access to only 24 per cent of the total land holding (Table 2). The small farmers were comprised of 42 per cent of the total farmers having access to 44 per cent of the total land. Farmers with land holding of more than two hectare constituted only 17 per cent of total sample farmers having access to 32 per cent of total land holding, showing inequality in distribution of land holding in favour of big farmers. The study of proportion of flower area to the total land holding showed that the marginal farmers had high percentage of land under flower cultivation than that of other category of farmers. This showed that the flower cultivation was not skewed in favour of large farmers.
Table 2 Distribution of land holding among sample farms
| Particulars | Farms (per cent) | Average size of holding (ha) | Area under flower cultivation (per cent) |
| Marginal | 40.67 | 0.79 | 35.02 |
| Small | 42.00 | 1.36 | 27.99 |
| Others | 17.33 | 2.44 | 22.00 |
| Total | 100(150)* | 1.31 | 27.00(55.06)* |
* Figures within parentheses indicate total number of sample farms and total area (ha) under flower cultivation
Rice was dominated in the cropping pattern (43 per cent) followed by black gram (12 per cent), chrysanthemum (8 per cent), rose (8 per cent), tomato (7 per cent) and Jasmine (6 per cent) on sample farms. The farmers have devoted about 6 to 9 per cent of the gross cropped area under rose cultivation in the study area.
Table 3 Cropping pattern of selected farmers
(Percent)
| Crops | Marginal | Small | Others | All |
| Rice | 40.24 | 49.12 | 35.66 | 43.40 |
| Black gram | 9.82 | 13.28 | 13.30 | 12.39 |
| Tomato | 10.17 | 5.63 | 4.38 | 6.49 |
| Ragi | 1.75 | 4.94 | 8.28 | 4.97 |
| Rose | 8.77 | 5.85 | 8.46 | 7.27 |
| Chrysanthemum | 9.82 | 7.35 | 6.65 | 7.81 |
| Jasmine | 6.31 | 5.73 | 6.04 | 5.96 |
| Fruits and vegetables | 13.12 | 8.11 | 17.23 | 11.71 |
| Gross cropped area (ha) | 67.24 | 126.76 | 66.18 | 260.18 |
Figures within parentheses are the gross cropped area in ha.
Establishment cost
Rose is a perennial crop which requires high investment on the establishment of rose garden. The material cost constitute the almost more than half of the total cost of rose garden establishment and which was highest on the marginal farmers (Rs. 69707 per ha). Planting material which was the single component constituted nearly 50 per cent of total cost of establishment (Table 4). The fertilizer application accounted for major share in the material cost and the marginal farmers had incurred highest cost on this. The repeated application of fertilizer by marginal farmers was the main reason for the highest cost on this input. The labour cost was equally important and required for almost all farm operations. Weeding operation required higher labour followed by land preparation. The labour cost for irrigation was highest on other farm as to the number of application of irrigation was more on the other category of farms.
Table 4: Establishment cost of rose cultivation
(Rs. per ha)
| Items | Marginal | Small | Other | All |
| Material cost | ||||
| FYM | 2729 | 1792 | 1625 | 2035 |
| Planting material | 51144 | 47877 | 47286 | 48721 |
| Plant protection chemicals | 5768 | 5041 | 7148 | 5892 |
| Fertilizer | 10066 | 9283 | 9288 | 9529 |
| Sub total | 69707 | 63994 | 65347 | 66176 |
| Labour cost | ||||
| Land preparation | ||||
| Human labour | 7551 | 6833 | 6964 | 7096 |
| Machine labour | 4195 | 4245 | 3455 | 3996 |
| FYM application | 2661 | 1943 | 1884 | 1994 |
| Fertilizer application | 1478 | 1124 | 909 | 1171 |
| Plant protection | 1967 | 1264 | 1513 | 1557 |
| Weeding | 12208 | 9443 | 8975 | 10167 |
| Irrigation | 6817 | 6461 | 7627 | 6917 |
| Sub total | 36877 | 31314 | 31327 | 32897 |
| Total | 106583 | 95309 | 96675 | 99073 |
Costs and returns
The cost of rose cultivation was also very high in comparison to field crops. Cost A1 in rose cultivation was found to be Rs. 123931 per ha (Table 5). The major component in cost A1 was total marketing cost (Rs. 43599 per ha) followed by hired labour (Rs. 28323 per ha), manures and fertilizers (Rs. 22735 per ha), amortized establishment cost (Rs. 12723 per ha), plant protection chemical (Rs. 10020 per ha) and depreciation (Rs. 3625 per ha). The amortized establishment cost was highest in the case of marginal farms followed by small farms and other farms which exhibited inverse relationship with the size of farms. Application of manures and fertilizers had direct relationship with size of farms. Similar pattern was observed in use of plant protection chemicals and interest on working capital. Interest on fixed capital was very high on marginal farms followed by small farms and other farms and hence resulting cost B1 was Rs. 135686, Rs. 156302 and Rs. 137009 per ha, respectively. Average costs B2, C1 and C2 were Rs. 162988, Rs. 175681 and Rs. 200331 per ha, respectively.
Table 5: Costs of rose cultivation
| Items | Marginal | Small | Others | All |
| Cost A1 | 120667 | 141589 | 124927 | 124931 |
| Cost B1 | 135686 | 156302 | 137009 | 138338 |
| Cost B2 | 159890 | 180468 | 163509 | 162988 |
| Cost C1 | 182822 | 198714 | 164822 | 175681 |
| Cost C2 | 207026 | 222880 | 191322 | 200331 |
| Cost C3 (total cost) | 227729 | 245168 | 210454 | 220364 |
| Cost of production (Rs. per stem) | 0.44 | 0.37 | 0.44 | 0.41 |
Rose stem yield was 498983 numbers per hectare on marginal farms as against the yield of 635951 stems on small farms (Table 6). Similarly, yield of rose pieces per ha was highest on small farms (48338 nos.) followed by marginal farms (44830 nos.) leading to highest gross return for small farms (Rs. 432703) as against other farms (Rs. 306250). The average farm business income on the sample farms was observed as Rs. 221821 per ha which was highest on small farms (Rs. 291114) as compare to others. The family labour income also exhibited same pattern. Net income over Cost C1, C2 and C3 were observed as Rs. 171071, Rs. 146421 and Rs. 126388 per ha, respectively. Further, farmers fetched net return of Rs. 0.24 from selling of one stem of rose flower. Gini coefficient was estimated to know the inequality in net income realization among different size of farmers from flower cultivation. Low value of coefficient (0.15) indicating that net income was equitably distributed among the rose.
Table 6 Productivity and returns from rose cultivation
(Rs. per ha)
| Items | Marginal | Small | Others | All |
| Productivity | ||||
| Stems (nos.) | 488983 | 635951 | 446428 | 507136 |
| Pieces (nos.) | 44830 | 48338 | 40178 | 42785 |
| Returns | ||||
| Gross Income | 335771 | 432703 | 306250 | 346752 |
| Farm business income | 215104 | 291114 | 181323 | 221821 |
| Family labour income | 175881 | 252235 | 142741 | 183764 |
| Net income over cost C1 | 152949 | 233989 | 141428 | 171071 |
| Net income over cost C2 | 128745 | 209823 | 114928 | 146421 |
| Net income over cost C3 | 108042 | 187535 | 95796 | 126388 |
| Net return (Rs. per stem) | 0.21 | 0.28 | 0.20 | 0.24 |
Marketing cost
A perusal of Table 7 showed that total marketing cost incurred was Rs 43599 per ha and Rs 0.081 per piece of rose. Further among total marketing activities, transportation cost constituted maximum share (41 per cent) followed by loading and unloading charges (32 per cent). Commission charges were not found to be charged for marketing of rose flowers.
Table 7: Share of marketing functions in marketing cost of rose flowers
(Per cent)
| Particulars | Marginal | Small | Others | All |
| Packing | 9.01 | 8.44 | 9.06 | 9.06 |
| Loading and unloading | 31.03 | 32.22 | 32.08 | 32.08 |
| Transport | 39.36 | 40.50 | 40.61 | 40.61 |
| Spoilage | 20.61 | 18.84 | 18.25 | 18.25 |
| Total marketing cost ( Rs per ha) | 43290 | 53722 | 38188 | 43599 |
| Total marketing cost (Rs. per stem) | 0.083 | 0.080 | 0.081 | 0.081 |
Farm efficiencies in rose cultivation
Average technical efficiency in rose cultivation was found to be 78 per cent (Table 8). For marginal, small and others category of farmers, it was 75, 85 and 71 per cent, respectively. It is to be noted that small farmers were technically more efficient than other categories in rose cultivation. Being perennial crop, rose requires high establishment cost which may lead to the marginal farmers to underutilize resources and thus they may be less efficient than small farmers. Overall allocative efficiency was 84 per cent and small farmers were more efficient than others. Similar trend was found in case of economic efficiency which is the product of technical and allocative efficiency.
Table 8 Farm efficiencies in rose cultivation
(Percent)
| Particulars | Marginal | Small | Others | All |
| Technical efficiency | 75 | 85 | 71 | 78 |
| Allocative efficiency | 79 | 87 | 86 | 84 |
| Economic efficiency | 59 | 74 | 60 | 65 |
Rose farmers were further categorized based on different levels of farm efficiency (Table 9). No farmer was found to lie in the category of less than 20 per cent. This validates the remunerative nature of rose cultivation because of judicial use of resources in its cultivation as compared to field crops. More than 50 per cent of farmers were found to be lying in the range of more than 80 per cent efficiency. Thus rose cultivation has great potential of using limited resources rationally and thus increasing well being of the farmers. For economic efficiency, maximum farmers were found in the range of 60-80 per cent.
Table 9 Distribution of rose farms according to efficiencies
| Particular | Technical efficiency | Allocative efficiency | Economic efficiency | |||||||||
| M | S | O | A | M | S | O | A | M | S | O | A | |
| <40% | 5 | 0 | 0 | 2 | 0 | 0 | 0 | 0 | 9 | 6 | 0 | 6 |
| 40-60% | 23 | 11 | 10 | 16 | 5 | 0 | 0 | 2 | 41 | 17 | 70 | 38 |
| 60-80% | 23 | 33 | 80 | 38 | 45 | 28 | 10 | 32 | 45 | 44 | 30 | 42 |
| >80% | 50 | 56 | 10 | 44 | 50 | 72 | 90 | 66 | 5 | 33 | 0 | 14 |
| Total | 100 (22) | 100 (18) | 100 (10) | 100 (50) | 100 (22) | 100 (18) | 100 (10) | 100 (50) | 100 (22) | 100 (18) | 100 (10) | 100 (50) |
Note: M,S,O and A stands for Marginal, Small, Others and All.
Employment potential
There was an overall average employment of 808 days in rose production per ha (Table 10). The farm size-wise analysis showed that small category of farms provided more employment opportunity followed by marginal and other categories of farms. Decomposition of use of total human labour into male and female labour showed that more than four-fifths of the total labour was provided by female workers. Further, decomposing the use of total human labour into family and hired labour showed substantial variation across the different farm categories. The marginal farmers employed more family labour (65 per cent) than that of small (55 per cent) and others (39 per cent) categories of farmers as expected. Of the total family labour, the share of female worker was 81 per cent on marginal farms and it was decreased to 74 and 61 per cent on small and others sizes of farms, respectively. On the other hand, the proportion of female labour in the total hired labour was worked out to be higher than the share of family female labour on all size of farms. Of the total hired labour per ha per year, the share of female worker was around 90 per cent on all categories of farms. Although, there were more employment opportunities for hired labour on others category of farms, there was also a good employment opportunities for hired labours on the marginal and small farms.
Table 10 Employment potential in rose cultivation
(Days per ha)
| Particulars | Marginal | Small | Others | Total |
| Family labour | ||||
| Male | 106 (19) | 120 (26) | 106 (39) | 112 (26) |
| Female | 446 (81) | 348 (74) | 169 (61) | 326 (74) |
| Total family labour | 552 ((65)) | 468 ((55)) | 276 ((39)) | 437 ((54)) |
| Hired labour | ||||
| Male | 34 (11) | 34 (9) | 40 (9) | 36 (10) |
| Female | 261 (89) | 352 (91) | 391 (91) | 335 (90) |
| Total hired labour | 294 ((35)) | 386 ((45)) | 431 ((61)) | 371 (46) |
| Total labour | ||||
| Male | 140 (17) | 155 (18) | 147 (21) | 148 (18) |
| Female | 706 (83) | 700 (82) | 561 (79) | 661 (82) |
| Total human labour | 846 | 855 | 707 | 808 |
Note: Figures in the single parentheses are percentages to their respective total.
Note: Figures in the double parentheses are percentages to total labour.
Forward and backward linkage
The farmers’ perceptions were recorded about value chain in the rose production system. It was reported by almost all the rose farmers that the planting material, which constituted nearly 50 per cent of total cost of establishment, was supplied by the traders and it was not the choice of farmers. Secondly, Rose is mainly marketed through the pre-trade agreement between the farmers and traders at some fixed prices. Hence, the commission charges were not found to be charged for marketing of rose flowers because commission agents were not involved in rose marketing. Thirdly, almost all the farmers opined that the flower was transported to the market through the common vehicle and share the cost of transportation. Even then, the transportation cost constituted maximum share (41 per cent) in the total marketing costs. It can be concluded that although, the rose farmers were realizing few benefits of these inbound and outbound activities, there is no effective value chain in the rose production.
Constraints to rose cultivation
Rose is the perennial crop, which requires labour almost every day for harvesting and other intercultural operations. This was the major constraint to all categories of farmers that was ranked first to other category and second to marginal and small category (Table 11). This crop requires high establishment cost that was ranked first to small category farmers and second to others. For marginal farmers the non availability of institutional credit was the main constraint that was ranked second to them. The other important constraints were problem of pest, high cost on fertilizer and manure.
Table 11 Constraints to rose production
| Constraints | Marginal | Small | Other | All | ||||
| MS | R | MS | R | MS | R | MS | R | |
| Non-availability of labour | 66.45 | 2 | 63.66 | 2 | 77.20 | 1 | 67.60 | 1 |
| High establishment cost | 51.22 | 4 | 72.77 | 1 | 68.90 | 2 | 62.52 | 2 |
| Incidence of pest and disease | 38.68 | 6 | 37.72 | 5 | 47.40 | 4 | 40.08 | 3 |
| High fertilizer required | 32.40 | 7 | 44.38 | 4 | 45.70 | 5 | 39.38 | 4 |
| Climate | 21.04 | 9 | 58.05 | 3 | 43.80 | 6 | 38.92 | 5 |
| Non-availability of credit | 74.18 | 1 | 10.33 | 8 | 5.40 | 12 | 37.44 | 6 |
| Lack of awareness | 56.45 | 3 | 6.11 | 12 | 20.20 | 7 | 31.08 | 7 |
| High cost of irrigation | 46.13 | 5 | 3.11 | 14 | 3.10 | 13 | 22.04 | 8 |
| Non-availability of planting material | 8.36 | 12 | 8.50 | 9 | 52.90 | 3 | 17.32 | 9 |
| High interest rate | 21.54 | 8 | 4.22 | 13 | 6.80 | 11 | 12.36 | 10 |
| Non-availability of timely irrigation | 5.00 | 13 | 23.88 | 6 | 2.50 | 14 | 11.30 | 11 |
| High wage rate of labour | 8.68 | 11 | 11.22 | 7 | 14.60 | 9 | 10.78 | 12 |
| Lack of technical know-how | 12.59 | 10 | 7.77 | 10 | 9.00 | 10 | 10.14 | 13 |
| Soil type | 3.36 | 15 | 6.94 | 11 | 15.40 | 8 | 7.06 | 14 |
| Low income | 4.77 | 14 | 2.22 | 15 | 1.50 | 15 | 3.20 | 15 |
Note; MS stand for mean score and R for rank.
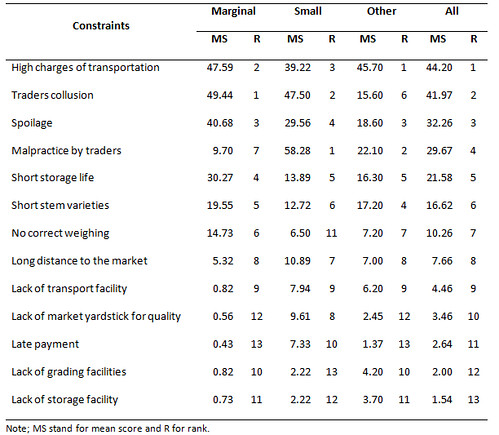
Constraints to rose flower marketing
Price fluctuation was not found to be a constraint in rose marketing because the prices are fixed by pre-trade agreement between farmers and trades (Table 12). The transportation was the major constraint to all categories of farmers. The traders’ collusion and malpractice were other major constraints. They cheat the farmers in quality specification and price fixations. The spoilage, short stem varieties and short storage life were also reported to be also the constraints for the rose marketing.
Table 12 Constraints to rose flower marketing
Summary and conclusions
There was an impressive growth in the area under rose cultivation in most of the major rose growing districts in Tamil Nadu. However, the instabilities was also very high in most of the districts. The selected farmers have devoted a good proportion of area under rose cultivation. Although, the rose cultivation requires high establishment, cultivation and marketing costs, the cultivation of rose was generating impressive and equitable returns to the farmers. The farmers were also efficient in rose cultivation. Further, the production system was generating good employment opportunities for farm family as well as agricultural labourers especially for female workers. Although, some inbound logistics (such as the planting material was supplied by the traders), outbound logistics (as the flowers were transported through the common vehicle) and marketing activities (as the flowers were marketed mainly through the pre-trade agreement between the rose growers and traders at fixed prices) were practiced, there is no effective value chain in the rose production. Due to this, the farmers have faced many constraints in the cultivation and marketing of rose flower. The shortage of labour, high establishment cost, incidence of pests and diseases, high fertilizer requirement, adverse climate and non-availability of credit were found to be the major constraints to the rose production. High transportation cost, traders’ collusion and mal-practices among traders, spoilage due to poor transportation facilities, shorter stem varieties and shorter storage life were identified as the major constraints in the marketing of rose flowers. To reduce the production and marketing risks in rose production and to improve the livelihood security of farm and non-farm households, an efficient and effective value chain in rose production has become imminent.
The finding of the study suggested some value chain activities as development of long stem, high yielding and pest and disease resistant rose varieties, adoption of integrated pest and nutrient management technologies, insurance and forward contracts, cheap loan facilities, women labour empowerment, establishment of processing units in the production centres and cold storage transport facilities at affordable prices and strengthen the marketing channels to develop competitive edge and create values in rose production
REFERENCES:
1. Garett, H.E. and Woodworth, R.S. 1969. Statistics in Psychology and Education, Bombay, Vakile, Fetter and Simons Pvt. Ltd. p:329.
2. Goyal, S.K. 1999. Economics of rose cultivation and its marketing in Sonepat district of Haryana, Indian Journal of Agricultural Marketing, 13(3): 44-51.
3. Guledagudda, S.S. 1996. Production and marketing of flowers in Dharwad district, Karnataka: An economic analysis, Unpub. M.Sc.(Agri.) thesis submitted to U.A.S., Dharwad.
4. ICAR, 2001. Handbook of Horticulture, ICAR New Delhi.
5. Jyothi, S.H. and Raju, V.T. 2003. Study on marketing of Crossandra, Jasmine and Rose flowers in East Godavari District of Andhra Pradesh, Agricultural Marketing, 46(2): 2-4.
6. Pushpalatha, M.C., Reddy, T.V. and Reddy, B.V.C 1997. Economics of rose production in Bangalore district of Karnataka, Financing Agriculture, 28(1): 10-14.
7. Sarkar, D. and rahim, KM.B. 1997. Cultivation of rose and competing crops in West Bengal, Sourthern Economist, 36(12): 20-22.
8. Seethe, K.L., Maheswari, M.L. and Gupta, R. 1985. Status of rose cultivation in Aligarh district, Indian Perfumer, 29(3&4): 187-192.
9. Singh, H.P. 2009. Floriculture industry in India, National Conference on Floriculture for Livelihood and Profitability, 16-19 th March, IARI, New Delhi.
10. Sivaramane, N., Kumar, A., Singh, D.R. and Arya, P. 2008. An economic analysis of traditional and hi-tech Rose cultivation, Journal of Ornamental Horticulture, 11(1): 21-26.
11. Sudha, M. 2001. Economics of protected cultivation of cut-rose for international markets: role of price prediction models in intergrating production with marketing, Agricultural Economics Research Review, 14(1): 1-15.
About Author / Additional Info:
Sr. Scientist, Division of Agricultural Economics, IARI, New Delhi.