Flocculation is a desirable and important characteristic that is unique to brewers yeast. When brewers yeast nears the end of fermentation, single cells aggregate into clumps of thousands of cells, and drop to the bottom of the fermenter, leaving clear beer behind. If yeast flocculate too early, the beer will not be of good quality and taste sweet. If yeast do not flocculate, the beer will be cloudy and have a yeasty taste.
Most strains of yeast, "wild" yeast, do not flocculate well, and remain in suspension for extended periods of time. Brewers continually collected yeast either from the bottom or top of a fermenter and in doing so select for increasingly flocculent stains. To check this process quickly a new method could be applied.
Even this method could be used while screening yeast from natural source. And experiment could be done in laboratory scale fermenter checking its flocculation pattern with numerical value at various stages of fermentation and thus select best flocculating strain that flocculate in due time. Here the method is discussed and a single result with calculation is shown in detail to help the students of microbiology.
Principle:
The Poisson distribution is important in describing random occurrences of microbial cell when the probability of an occurrence is small. The terms of the Poisson distribution are P(x) = e-uμx/x!
Where P(x) is the probability of x occurrences in a unit of space and μ is the population mean number of occurrences in a unit of space,
μ = Ʃfx / Ʃf.
The formulae of Poisson distribution is e-μ (1, μ, μ2 /2!, μ3/3!, μ4/4!,......μi/i!), where e is the base of natural logarithm. e= 2.7183.
In calculating series of Poisson probabilities we will use a simple computational expedient.
P(x)= P(x-1)μ/x.
To see whether a Poisson distribution fits an observed distribution we calculate the expected frequencies corresponding to different observed frequencies and compare the two series. If there is a close agreement between the two we conclude that the fit is good.
The expected frequency fe of the value x of the variable is given by
fe= [P(xi)][n]. Where xi = 0,1,2,3,4.... and n is the total no of observed frequency n= Ʃf
xI=number of cells per smallest square.
The Goodness of fit of the Poisson distribution to a set of observed data may be tested by Chi square χ2.
χ2 = (O-E) 2 /E Where O and E represents the observed and expected frequencies respectively.
Requirements
1) Diluted sample of yeast cells at different stages of fermentation.
2) Hemocytometer
3) Microscope
4) χ2 table
5) Calculator.
Procedure
1) A drop of properly diluted sample (yeast cell suspension) was placed on the engraved grid and the preparation was allowed to stand for 1-2 minutes to allow settling.
2) A cover slip was placed over the grid taking care that air bubble does not enter.
3) The chamber was placed on the stage of the microscope and was observed first under 10X and then under 42X.
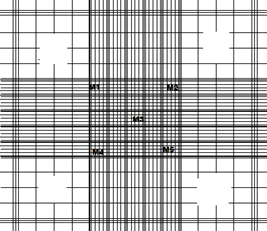
4) Counting were made in at least 5 medium sized squares ( i.e. 16X5 = 80 small squares ) of the central large square as shown in the figure.
Result
| Square no | 1 | 2 | 3 | 4 | 5 | 6 | 7 | 8 | 9 | 10 | 11 | 12 | 13 | 14 | 15 | 16 | Total |
| M1 | 2 | 1 | 1 | 2 | 4 | 0 | 3 | 2 | 0 | 4 | 2 | 1 | 3 | 1 | 2 | 2 | 30 |
| M2 | 4 | 1 | 2 | 0 | 1 | 4 | 0 | 3 | 3 | 2 | 1 | 3 | 0 | 0 | 4 | 1 | 29 |
| M3 | 1 | 5 | 1 | 3 | 0 | 2 | 1 | 0 | 4 | 2 | 2 | 2 | 0 | 1 | 2 | 0 | 26 |
| M4 | 1 | 3 | 1 | 4 | 2 | 0 | 5 | 1 | 3 | 2 | 1 | 2 | 2 | 1 | 4 | 0 | 32 |
| M5 | 2 | 2 | 2 | 3 | 1 | 3 | 2 | 2 | 1 | 4 | 3 | 3 | 1 | 0 | 2 | 0 | 31 |
| total | 148 | ||||||||||||||||
Total number of smallest square =n=Ʃf=80
Now μ=148/80=1.85
Probability of zero occurrence P(0)=e-μ= e -1.85=0.157237
P(X)=P(x-1)μ/x
Calculations
| Xi | fi=O(Observed frequency) | P(X)Probability of X occurring in unit space | fe=E(expected frequency | Approx. value | (O-E) | (O-E)2 | (O-E)2/E |
| 0 | 14 | 0.157237 | 0.157237x80=12.578 | 12.6 | 1.4 | 1.96 | 0.155 |
| 1 | 20 | 0.157237x1.85 =0.29088 | 0.2295x80=18.36 | 18.4 | 1.6 | 2.56 | 0.139 |
| 2 | 23 | (0.29088x1.85)/2 =0.26906 | 0.26906x80=21.52 | 21.5 | 1.5 | 2.25 | 0.104 |
| 3 | 12 | (0.26906x1.85)/3 =0.1659 | 0.1659x80=13.272 | 13.3 | -1.3 | 1.69 | 0.123 |
| 4 | 9 | (0.1659x1.85)/4 =0.0767 | 0.0767x80=6.136 | 6 | 3 | 9 | 1.5 |
| 5 | 2 | (0.0767X1.85)/5 =0.0283 | 0.0283x80=2.264 | 2.2 | -0.2 | 0.004 | 0.0018 |
| Ʃf=80 | χ2 = Ʃ(O-E)2/E=2.0228 | ||||||
Here 0 to 5 terms gives =total 6 term
So chi square table is referred with 4 degree of freedom (2 less than the number of terms.
Note: an addition degree of freedom is deducted because μ is an estimate of the average rather than a true expected value) and the χ2 shows a value of 9.49 where p=0.05 (significance of probability) .
Discussion : This tabulated value is higher than observed value 2.0228 and therefore there may be no difference between the observed and expected data and this signifies that the yeast cells are randomly distributed at the earlier stage of growth, there is no flocculation at this stage.
If there is flocculation at later stage, the observed value will increasingly become higher than the tabulated value. So sampling can be done from pilot fermenter at different stages and at different depths in large fermenter.
Thus best flocculating yeast cells for brewing can be screened using this simple technique.
Precautions :
1) As because calcium causes flocculation care should be taken in media formulation.
2) Maltose should not be used as a diluent during count as it separates the flocculated cells.
3) Higher dilution should be used to count cells as they increase in number during growth.
References
Reference: Soares,E.V.(2010) Flocculation in Saccharomyces cerevisiae a review. Journal of Applied Microbiology ,vol110(1) 1-18.
About Author / Additional Info:
I am currently working as a Assistant Professor in Biology and as Head of the Department of Microbiology, St.Paul’s, Cathedral Mission College, Kolkata: Previously worked as a chemist in Yuksom Breweries, Sikkim.