Authors: Mahajan Mahesh Mohanrao1 (mahimm1@gmail.com), Pawar Deepak1
1Division of Molecular Biology and Biotechnology, IARI, New Delhi-110012
Population used for mapping the genes, is commonly called as mapping population and they usually obtained from controlled crosses. Selection of parents is the 1st step for production of mapping population. Parents selected to develop mapping population should have sufficient variation for trait of interest both at DNA sequence level and at phenotypic level. Higher the variation, it is easier to find the recombination. Parents should not be so diverse that they unable to cross.
Types of mapping population:
1) F2 Population
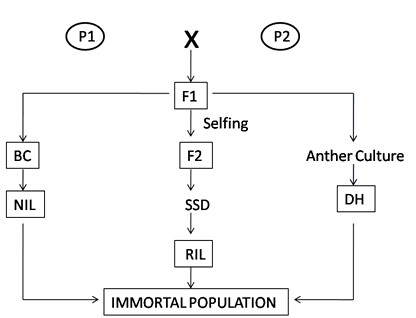
The simplest form of a mapping population is F2 population. Parent 1 (P1) and parent 2 (P2) are two parents contrasting for trait of interest crossed to get F1 population. Individual F1 plant is then selfed to produce an F2 population. F2 populations are outcome of single meiotic cycle. The segregation ratio for codominant marker is 1:2:1 (homozygous like P1:heterozygous:homozygous like P2) while segregation ratio for each dominant marker is 3:1.
Merits:
• Developed with minimum efforts
• Best for preliminary mapping
• Require less time for development
Demerits:
• Outcome of only one meiotic cycle
• Limited use for fine mapping
• Not immortal population
• Difficult to map quantitative trait
2) F2:3 Population
Selfing of F2 individuals for single generation results in F2:3 populations. Such populations suitable for specific situations like, mapping of quantitative trait, mapping of recessive genes. Demerit of F2:3 population is, like f2 population it is also not immortal.
3) Double Haploids (DH)
DH produced from chromosome doubling of pollen/egg derived haploid plants from F1. Another method of producing the haploids is wide crossing. For example haploids in barley, can be produced by wide crossing with Hordeum bulbosum. During the early stages of seed development the H. bulbosum chromosomes are eliminated producing haploid embryo. In DH all markers segregate in 1:1 ratio.
Merits:
• Immortal/ permanent population
• Used in mapping of both qualitative and quantitative trait
• Fast production of homozygous lines
Demerits:
• High cost involved in establishing tissue culture
• Somaclonal variation arise during DH production
4) Back cross population (BC)
Backcrossing is a method of crossing of a F1 hybrid with one of its parents. The offspring produced has genetic identity similar to that of the parent. In genetic analysis usually recessive parent is used.
Merits:
• Elite genotype of recurrent parent will produce elite genotype at the end of the backcrossing programme
• The elite combination is not lost
• Less time require to develop
Demerits:
• Cant used for quantitative traits
• More restricted for recessive traits
• Require many seasons to develop new cultivar
• Not immortal
5) Recombinant Inbreed Line (RIL)
RIL population is developed using continuous selfing or sibmating progeny of individual member of F2 population until complete homozygosity is achieved. Single seed descent method is best for development, bulk or pedigree method without selection can be used. Segregation ratio of RILs is 1:1.
Merits:
• Immortal population
• Can be replicated over different locations
• Important for QTL mapping
• Product of many meiotic cycles so useful to identify tightly linked markers
Demerits:
• Require many seasons to develop RILs
• RIL development is difficult in crops having high inbreeding depression
6) Near Isogenic Lines (NILs)
NILs are lines of genetic codes that are identical except for differences at a few specific locations or genetic loci. NILs can be developed by repeated selfing or backcrossing of F1 with recurrent parent. Irrespective of dominant or codominant marker NILs segregate in 1:1 ratio.
Merits:
• Immortal population
• Used for tagging traits
• Used in functional genomics
• Used for fine mapping
Demerits:
• Many generations require to develop NILs
• Can’t used in linkage mapping
• Increased cost, time and efforts
• Linkage drag
Fig: Pictorial representation of development of mapping population
About Author / Additional Info:
Ph.D. scholar, worked on Metagenomics during masters and now working on Wheat for salinity tolerance.