Enhancers are known to boost the transcription of genes and they are identified as cell type specific and developmental stage specific. Enhancers are usually present in the non-coding regions of DNA. The enhancer recognition computational methods can be used just because sufficient genomic sequence data are available currently. Algorithms were developed to recognize evolutionarily conserved regions that are functionally important. Additional epigenetic data are considered to be required for predicting the enhancers accurately. Another study says that some chromatin signatures like monomethylation of histone at 4th lysine residue (H3K4 Me1) were associated with active enhancers. It is understood from several studies that combination of epigenetic marks were found to be essential for predicting the active enhancers.
Enhancer Recognition methods
A specialized algorithm designed for enhanced recognition will make use of informative features given as input to discriminate enhancers from cis-regulatory elements or non-enhancers. Enhancers are characterized by features, which are used as quantitative measures. The features are grouped in three categories which include TF binding related genetic features, comparative genomic features and epigenetic features.
The comparison of genomic sequences and their conservative scores of different species will be used for predicting functional genome regions or enhancers. TF binding features of genes represent the quantitative scores of TF binding affinity at the DNA sequence in the question. The DNA sequence binding to TF are identified first and then the binding affinity between DNA sequence and TF is measured later using chromatin immunoprecipitation technique. This method will help us to evaluate the frequency of TF binding events. Binding affinity is also evaluated based on the similarity of the DNA sequences that can bind with the TF binding motif.
The intensity of histone modification and DNA methylation are used for evaluating the epigenetic features that can help in predicting the enhancers. All these features are combined in optimum proportions to predict the enhancers in the whole genome. All the features are not important and any one is not sufficient to predict the enhancers. Some superior prediction methods will aid in improving the specificity and sensitivity of the prediction.
Algorithms for enhancer prediction generate graphical models which create the specific signal processes and they include Bayesian networks (BN) and Hidden Markov models (HMM). The other group of algorithms possesses filters to discriminate and also have certain classification limits in the features. This group includes artificial neural-networks or ANNs and support vector-machines or SVMs.

Enhancer recognition features
Comparative genomic features
By taking into consideration the slowly evolving regions of the genome and evolutionary conservation of genome regions, the putative enhancer prediction is made. The comparative genomic features constitute the conservation scores generated from multiple genome sequence alignment.
• Pairwise identity scores to detect conserved sequence blocks followed by transgenic assays were done for measuring the activity of enhancers.
• Ultra conserved non-coding elements were also found to be equipped with enhancers.
• Enhancers with less conservation were observed to carry identical regulatory patterns in various species.
Transcription factor binding associated genetic features
The TF binding affinities are measured depending on the preferred nucleotides at each position as it is done in position weight matrix (PWM). This matrix comprises of the probability of observing the -four nucleotides in every position of the sequence motif. A strong correlation has been established between the TF binding affinity and PWM. The known TFs were deduced with their corresponding PWMs which help in calculating quantitative scores for any DNA sequence binding to the specific TF.
The functional TF binding sites are gathered into cis-regulatory modules. The statistical significance of TF binding sites is determined by MSCAN value. Position weight matrices represent TF binding sites and MSCAN determines the significance of them.
EEL method will scan the orthologous sequences and identify the conserved TF binding sites by EEL score. Pair-HMM statistical alignment between species were used in MorphMS. The first order Markov model has 3 states like match, deletion and insertion and gives out two strings. One string is used by a probabilistic model arranging the binding and non-binding sites by PWM. The likelihood of the sequence according to MORPH model was compared with that of null model and is calculated as two log likelihood scores LLR1 and LLR2.
TF binding in a given tissue is determined experimentally by ChIP followed by DNA sequencing technology. The determination of p300 as the predictive site for enhancer activity by transgenic assay and mapping of p300 genome wide in three cell types was done by chromatin immunoprecipitation method.
Epigenetic features
Chromatin structure
The DNA regions detected by DNAase I are found to be related to the active DNA regulatory elements like enhancers.
Histone modification
Augmentation of H3K4 Me1 and reduction of H3K4 Me3 is considered as an effective combination in predicting p300 binding sites. The algorithms could evaluate that the most efficient histone modifications used to predict active enhancers are H3-4th lysine residue-Methylation at 3 places and H3-4th lysine residue-monomethylation. In a study, p300 binding sites were compared with the conservation scores, resulting in 47 percent of conserved enhancers active when assayed, while 87.7 percent of p300 binding sites were active in the same assay.
Model building
Active enhancer regions were determined by experimental methods which may not guarantee the same performance of one dataset in another model. This is because of difficulty in interpreting the importance of every feature. The features associated with enhancer activity were identified by the LASSO linear regression method. It could give 92 percent accuracy in discriminating active enhancers from non-coding sequences.
More sophisticated methods like ANNs and SVMs were used for creating an optimum space for a feature. The time-delay neural network model using 39 histone modifications could identify 66.3 percent of enhancer regions. These putative regions coincided with enhancers supported by experiments. Nearly 77 percent of muscle specific enhancers in Drosophila were predicted as per the ChIP sequence data of 5 different TFs. Another model based on five histone modifications called ChromaGenSVM overlapped with 57 percent of experimentally supported enhancers.
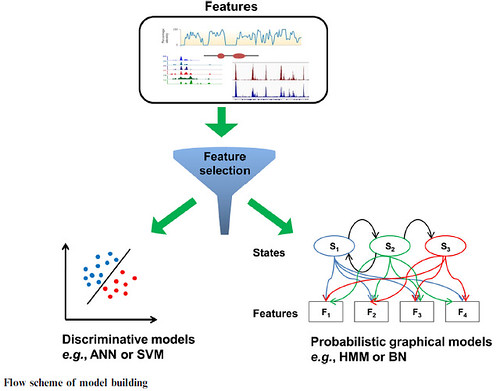
BN method offers a strong model that can identify the hidden relationships describing the chromatin patterns in the genome. BN is a probabilistic graphical model representing the effective probability distribution on a set of features.
Reference:
Chengqi Wang, Michael Q.Zhang, Zhihua Zhang. Computational identification of active enhancers in model organisms. Genomics Proteomics Bioinformatics 11 (2013), 142-150.
About Author / Additional Info: