Author: Ranadheer Palle
Domestic animals are considered as excellent models for genetic studies of phenotypic evolution. They have evolved genetic adaptations to a new environment, the farm, and have been subjected to strong human-driven selection leading to remarkable phenotypic changes in morphology, physiology and behaviour. Identifying the genetic changes underlying these developments is expected to provide new insight into general mechanisms by which genetic variation shapes phenotypic diversity. The most domesticated fowl chicken is widely preferred for such studies.
Further, there has been a long and continuing interest among poultry breeders and scientists in relationships of domestic fowl with their jungle fowl ancestor. Recent commercial practices in poultry breeding have greatly changed and improved the meat and egg stocks available for the production of food. There is a concern, however, that artificial selection for traits of economic importance has caused a narrowing of the genetic base and subsequent reduction in genetic variability. Because continued progress in the achievement of increased growth or egg production depends heavily on genetic variability, its present status is of interest. Current techniques in molecular biology allow estimations to be made of genetic distance among populations. One such is the DNA fingerprinting technique (Siegel et al.).
RFLPs are differences in the length of DNA fragments after digestion with restriction endonucleases. These differences in length are caused by variations, or polymorphisms in the DNA sequences in the genome. Restriction enzymes cleave double stranded DNA by hydrolyzing the backbone between the deoxyribose sugar and the phosphate at the 5’ phosphate and the 3’-OH. These enzymes bind, loosely at first, to the DNA and move along it until it comes in contact with the recognition sequence. The tighter binding with the recognition sequence then leads to a conformational change that allows the enzyme to cleave the DNA.
Since there are a number of polymorphisms in the genome it happens that some of these variations would occur at the recognition sequences for restriction enzymes. If an enzyme would normal recognize a sequence such as GAATTC (for EcoR1), it would inhibit the enzyme’s ability to cleave the DNA, or conversely a non-cleavage sequence could be changed to a recognition sequence, causing the enzyme to cut the DNA. These different cleavage sites lead to differences in the length of the DNA segments after digestion. When the digested DNA is run with gel electrophoresis, there can be a detectible difference in the bands from two individuals. This information is useful for producing a DNA profile of an individual that serves as a marker for specific identifications [PLATE 2].
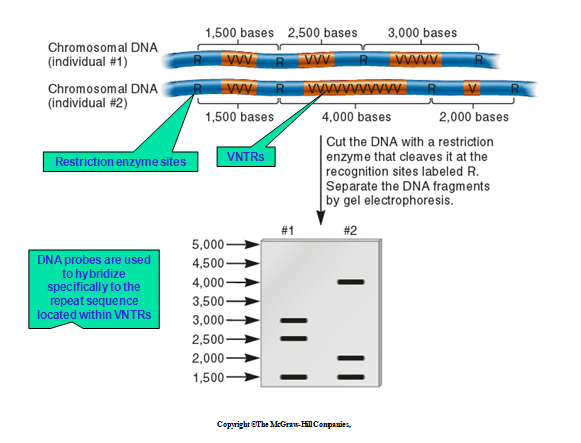
PLATE 2: Creating a DNA profile
DNA from birds that have different traits tries to identify genetic differences between them. Differences in the proteins (products of the genes) the genes codes are what affects the trait. In the chicken, genes (or DNA sequences) produce proteins that have an influence on the production traits that we are interested in, including egg number and size, shell quality, feed efficiency, livability etc. DNA is found in almost all cells of the chicken, including blood. Even though the traits can’t be seen until the birds mature, we can test the DNA in chicks. But the molecular tools will help to identify the chick that has the gene that will give the best trait. This allows molecular aided breeding by the utilization of molecular markers.
With such an aim to identify a marker for the chicken selected, an attempt to create a DNA profile unique to the specific individual was made and the following results were obtained.
The genomic DNA samples isolated from different methods, run on 0.8% Agarose were showing orange fluorescence bands when observed under U.V Trans-illuminator. The concentration of the DNA obtained by the five methods is more or less. A clear insight into the picture shows the variations in the band position from one individual to another individual indicating that the molecular weight of the genomic DNA is different for each other.
AGAROSE GEL ELECTROPHORESIS OF THEGENOMIC DNA CHICKEN-1,2 SAMPLES:
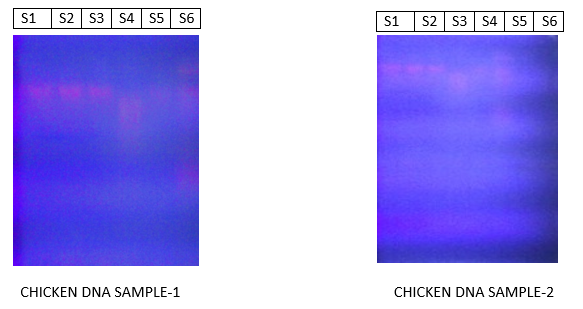
Figs1,2: GENOMIC DNA IN THE FORM OF ORANGE COLOURED FLUOTESCENT BANDS
S1-DNA from the chicken anti-clotted blood by bunce method
S2-DNA from the chicken anti-clotted blood by sambrook et al method
S3-DNA from the chicken clotted blood by bdrc method
S4-DNA from the chicken blood dried on filter paper (filter paper DNA)
S5-DNA from the chicken feather method 1
S6-DNA from the chicken nail.
RFLP
When the Genomic DNA samples subjected to restriction digestion were run on 0.1% agarose gel, the smeared bands (because of the digestion of genomic DNA) were obtained at different lengths from the well. This shows that bands did not match. The restriction sites for EcoR1&Hind3 enzymes are not located at the same positions in the ten DNA samples. So, the five samples came from different organisms.
About Author / Additional Info:
I am currently pursuing PhD in Biotechnology from University of Periyar.