Authors: PARIMAL RAMESH UDGAVE
This laboratory programme used PC3 cell lines to access the cytotoxicity of the DR5Mab (Death Receptor 5 agonistic monoclonal antibody). PC 3 cells lines belong to Human, Caucasian, grade IV, prostate cancer derived from bone metastasis (Kaighn, et., al 1979). PC3 cells are unable to express PSA (Prostrate specific antigen) and are PSMA-negative (prostate-specific membrane antigen). PC3 cells divide rapidly and arise as an adherent monolayer. In this laboratory programme, PC3 cells were used to verify the effect of DR5Mab on cell viability and apoptosis.
Apoptosis is popularly known as PCD ie. Programmed Cell Death. It is a process where the cells are destroyed from cells when they are damaged or become abnormal. DRS (death receptor 5) belongs to TNFR1 (Tumour Necrosis Factor 1) family. In this experiment, PC3 cells were killed by an agonistic antibody which induces apoptosis in it. According to min et al., 2014, DR5 binds with a cognate ligand, the signal was activated by death-inducing signalling complex (DISC), Fas-associated death domain activates caspases particularly 8. DR5 induces apoptosis in PC3 cells.
Apoptosis process is illustrated by the following image.
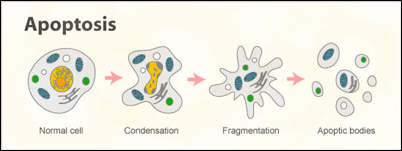
Figure: 1 Conversion of normal cell to apoptotic cell
As figure 1 shows, cells go through this cycle from condensation, fragmentation and apoptosis. To assess this type of changes we are using MTT assay which checks the viability of cells. MTT is 3-(4, 5-dimethylthiazol-2-yl)-2-5-dipehenyl tetrazolium bromide. It is very easy to recognise the metabolic activities of cells by using this assay. It is based on the principle that reduction of MTT is done by succinate dehydrogenase which is present in the mitochondria. This assay measures the reduction of MTT. When MTT passes through the mitochondria of the cell then, formazan product is formed which is dark purple in colour. Organic solvents such as isopropanol or ethanol can be used to solubilize with the formazan product to measure that spectrometrically. MTT is reduced only within metabolically active cells so the reduction in cells can be taken as the viability of cells. Metabolism of the cells is dependent mainly on the NAD (P) H-flux. Crystal violet was also used to stain DNA. The colour intensity shows the number of cultured cells.
Effect of DR5 Mab was measured by using Harris’s Haematoxylin which turns the colour of nuclei to blue. By using this, malignant and non-malignant cells can be easily identified. Light microscopic pictures of the cell were taken to check the effect and changes in cells.
Materials and Methods
Week 1:
Required Reagents: 1 T75 flask of PC3 cells, DMEM medium, Trypsin, EDTA and PBS.
Equipment: T75 flasks, 96 well plates, centrifuge tubes, multichannel pipettes and tips, and Bijoux tubes.
Protocol: Cell culture medium was discarded from the T75 flask. Cells were washed with PBS and poured off. Trypsin was added and poured on the surface of cells. Cells were then incubated for 2 minutes in the incubator. Cells were dislodged and observed. DMEM medium was added to the flask. These cells were centrifuged at 1000 rpm for 5 minutes by using falcon tubes. Pellet was observed and it was re-suspended into 5 ml of DMEM. Cells were counted by using haemocytometer. Square A and B cells were counted and by adding their number and multiplied by 10000. Cells were diluted by adding appropriate dilution factor to cells. Dilution was made by adding DMEM. The Same concentration of 200 µl of PBS was added to outer wells of a 2 X 96 well plate. Figure 2 shows the plan used for pipetting cells with different dilutions.
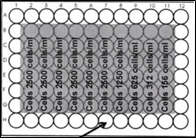
Figure: 2 plan for pipetting cells with different dilutions
Cells with 2500 cells/ml was added to 1-7 column, 1250 cells/ml to column 8, 625 cells/ml to column 9, 325 cells/ml to 10, and 156 cells/ml to column 11 respectively. After that T75 flask was poured with 250,000 cells. These plates were incubated (37 0 c) for a week.
Week 2:
Required Reagent: stock antibody DR5 Mab and DMEM
Protocol: Bijoux (5 ml X5) were labelled with dilutions 0, 25, 100 and 2000 ng/ml DR5 Mab. DR5 Mab of concentration 2000ng/ml was made by adding 50 µg/ml to 5 ml of DMEM. Further dilutions were made by adding 1 ml of 200ng/ml DR5 Mab to 500ng/ml of DR5 Mab and 3 ml of medium. Again 1 ml of 500 ng/ml DR5 Mab was used for the preparation of next dilution ie. 100 ng/ml and 4 ml of medium. 25 ng/ml concentration was made by using 1 ml of 100 ng/ml and 3 ml of medium. Media was discarded from 96 well plate and Medium containing DR5 Mab was added sequentially as plan given in figure 3.
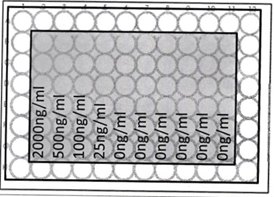
Figure: 3 shows plan for addition of DR5 Mab + DMEM medium
These 5 (2000, 500, 100, 25 and 0 ng/ml) dilutions of DR5 Mab + DMEM medium was added to the wells as plan. For the 0 ng/ml concentration, only media was used.
For the preparation of T25 flasks, T75 flask was used from week 1. The cells were passaged by using week 1 procedure and T25 flask were prepared. These flasks and 2 X 96 well plates were incubated (37 0 c) for a week.
Week 3:
Reagents: MTT, Control and DR5 Mab- treated flask and Trypsin-EDTA, PBS
Protocol: Medium from each flask was poured into 2 X 15ml tubes. Flasks were washed with 3 ml of PBS and added to each tube. For dislodging of cells trypsin-EDTA was added and poured into tubes. Flasks were again washed with PBS and added to 15 ml tubs. These two tubes were centrifuged at 1000 rpm and formed pellet was re-suspended by using PBS. Cells were again counted to ensure that minimum 200,000 cells/ml were present or not. Cytospin assemblies were prepared. Slides were labelled. Two slides were prepared one was control and another one was cells treated with DR5 Mab agonistic antibody. Cells were spun at 1000 rpm for 3 minutes. After that cells were removed from cytospin assembly and placed into 50:50 acetone/methanol in a Coplin jar in the hood for 5 minutes. Cells were washed under running tap water and stained with Harris’s haematoxylin for 1-2 minutes in Coplin jar. It is essential to ensure that cells were washed or not because if they don’t it will not stain with Harris’s haematoxylin Cells were again washed with tap water. Cells were washed in TBS and mounted in glycerol/TBS and observed under light microscope and images were captured. 4 x objective lens was used and cells were counted in each slide and percentage of cells in control cells ie. Untreated cells and treated cells were determined. After this MTT and Crystal violet assay was performed.
MTT Assay:
For this assay, 10 µl of MTT was added to all wells of a 96 well plate. The plate was incubated for 4 hrs at 370 c. The plate was removed from incubator after 4 hrs and all medium was discarded and replaced by 100 µl of acid-isopropanol to all wells. Because, of this formazan was dissolved in cells. After that, it was again incubated for 30 minutes. Absorbance at 570 nm was measured by using plate reader.
Crystal violet Assay:
Crystal violet assay was done by removing cell media from all wells and washed by PBS. Cells were fixed by using 200 µl methanol for 15 minutes. After that methanol was discarded and allowed to dry. After this 200µ/well crystal violet was added. And allowed to stain for 20 minutes. The plate was washed 3 times with water and stained by glacial acetic acid. The plate was incubated at incubator at 370 c for 30n minutes. Absorbance was measured by using plate reader at 540 nm.
Results:
Harris’s haematoxylin staining and light microscopy of slides for observing results of DR5 Mab on apoptosis
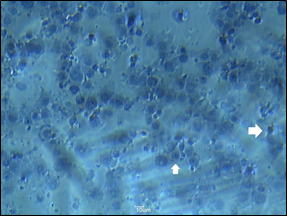
Cells were stained by using Harris’s haematoxylin and observed under the light microscope under 40 X lens. Cells were observed showing apoptotic changes. As figure 4 (b) shows some of the cells were shrinkage compared to the actual size of cells shown in figure 4 (a). It indicates the apoptotic process was taken place in cells. Cell fragmentation can be easily observed in figure 4 (b).

- untreated PC3 cells
- cells treated with DR5 Mab showing apoptotic changes
Effect of MTT and crystal violet assay on the viability of cells and number
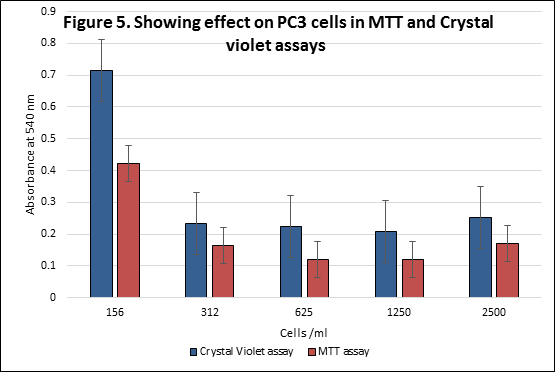
Table 1 illustrates the mean absorbance obtained from plate reader at 570 nm of PC3 cells and its standard deviations of MTT assay and crystal violet assay. It is also depicted in figure 5. It indicates that the number of PC3 cells is higher in Crystal violet assay as compared to MTT assay. The highest absorbance observed is at 156 cells/ml for both assays. The lowest absorbance for MTT assay is observed at 625 and 1250 cell/ml. 1250 cells/ml showed the lowest absorbance for crystal violet assay. Figure 5 indicates that absorbance for crystal violet assay is higher than that of MTT assay at all cells/ml levels.
Table 1 Showing effect on PC3 cells in MTT and Crystal violet assays
| PC3 cells/ml | Mean absorbance at 570 nm ± S.D MTT Assay | Mean absorbance at 570 nm ± S.D Crystal violet assay |
| 156 | 0.423± 0.523 | 0.714 ± 0.292 |
| 312 | 0.164 ± 0.034 | 0.233 ± 0.049 |
| 625 | 0.120 ± 0.022 | 0.223 ± 0.035 |
| 1250 | 0.119 ± 0.022 | 0.209 ± 0.022 |
| 2500 | 0.171 ± 0.08 | 0.251 ± 0.091 |
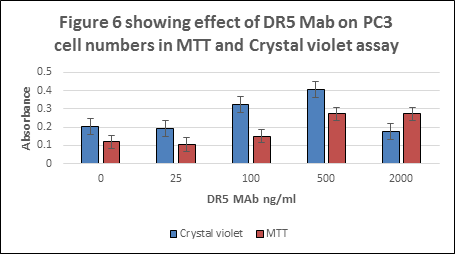
Effect of DR5 MAb on cell number shown by MTT and Crystal Violet Assay.
As earlier described in Figure 5 and Table 1, DR5 Mab was found to stimulate apoptotic process in cells which ultimately results in cell death. Figure 6 and Table 2 illustrates the effect of DR5 Mab on a number of cells. It was found that the cells without treatment of DR5 Mab were found to have the highest absorbance in MTT assay. 25 ng/ml showed lower absorbance for MTT assay. Crystal violet assay at 500 ng/ml of DR5 Mab showed higher absorbance. 500 and 200 ng/ml of DR5 Mab showed the same trend for MTT assay.
Table 2 showing effect of DR5 Mab on PC3 cell numbers in MTT and Crystal violet assay
| DR5 Mab ng/ml | Mean absorbance at 570 nm ± S.D MTT Assay | Mean absorbance at 570 nm ± S.D Crystal violet assay |
| 0 | 0.119 ± 0.0230 | 0.204± 0.027 |
| 25 | 0.106 ± 0.020 | 0.192 ± 0.0250 |
| 100 | 0.150 ± 0.083 | 0.323 ± 0.019 |
| 500 | 0.272 ± 0.033 | 0.405 ± 0.064 |
| 2000 | 0.273 ± 0.071 | 0.177 ± 0.04 |
Percentage survival of cells
Percentage survival = ( Mean absorbance of treated cell / Mean absorbance of controlled cells ) X 100
By using this formula percentage survival of cells can be calculated.
Table 3 showing percentage survival of cells with different concentrations
| DR5 MAb concentrations (ng/ml) | % survival in MTT assay | % survival in crystal violet assay |
| 0 | 197.18 | 93 |
| 25 | 87 | 97 |
| 100 | 25.38 | 28 |
| 500 | 55.63 | 29 |
| 2000 | 79 | 7 |
DISCUSSION
The overall aim of this experiment was to find out the apoptotic process taking place in PC3 cells by using DR5 MAb agonistic antibodies. PC3 Cells were chosen because it shows high and rapid growth and proliferation. Colour of DMEM Media in 96 well plates is the indication of the cells started to proliferate. Harris haematoxylin was used to stain the nuclei. Light microscopy indicated the apoptotic changes taking place in cells. The cells treated with DR5 MAb showed more apoptosis. DR5 MAb is a cytotoxic ligand. Different concentrations showed a different number of apoptotic cells. MTT assay which is enzyme based assay was used to access the viability and toxicity of cells by using dehydrogenase activity in mitochondria. MTT assay showed the lowest absorbance as compared to crystal violet because the apoptotic cells are unable to read through plate reader. Crystal violet is normally used to stain nuclei. A lower concentration of DR5 MAb indicated higher absorbance. The highest concentration of DR5 MAb killed cells and it showed lower absorbance.
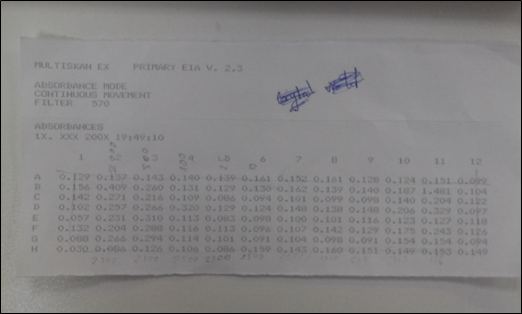
Absorbance data obtained from plate reader with DR5 MAb, using Crystal violet
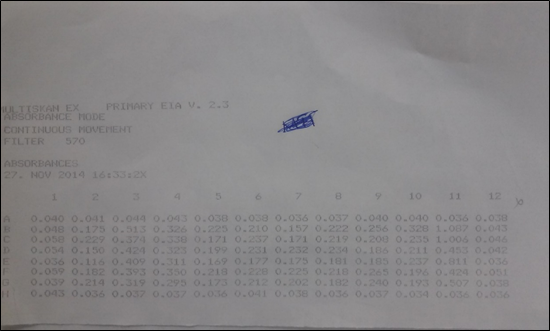
Absorbance data obtained from plate reader with DR5 MAb, using MTT
References:
1. Kaighn, M.E.; K.S. Narayan; Y. Ohnuki; J. F. Lechner; L.W. Jones (17 Jul 1979). Establishment and characterization of a human prostatic carcinoma cell line. Invest Urol. 17 (1), 16-23.
2. Min Lu,1* David A. Lawrence,1* Scot Marsters,1 Diego Acosta-Alvear,2,3 Philipp Kimmig,2,3 Aaron S. Mendez,2,3 Adrienne W. Paton,4 James C. Paton,4 Peter Walter,2,3†Avi Ashkenazi1†.(2014). Opposing unfolded-protein-response signals converge on death receptor5 to control apoptosis. sciencemag.org SCIENCE.345,98-101.
About Author / Additional Info:
I am working as Asst. professor. My scientific interests include Nano-biotechnology, Molecular Biology, Soil toxicology, Eco-toxicology and Environmental science.